Susan G. Komen Breast Cancer Foundation Financial research paper
Introduction
The following paper will focus on the Susan G. Komen for the Cure. Every organization needs a mission in order to survive in the long run. The mission of the organization is dedicated to the early detection and treatment of cancer while supporting the fight against breast cancer, funding research and helping people live more productive lives before, during and after a cancer diagnosis. The Komen organization is considered to be “the Gold Standard” among non-profits and one of the leading and largest breast cancer research organizations in the United States. As the demographic trends are showing upward slope, risk for the life in terms of diseases is increasing day by day. One of the major threats to life that has appeared over time is related to the breast cancer, and most of the people did not take this issue seriously.
The organization started its operations in the year 1991. By 2010, Komen had spent almost $1.5 billion towards the welfare of society. The organization has also invested in community cancer education programs, research methods, cancer awareness outreach programs and other social event programs. The Komen organization has bought a dramatic change in terms of creating awareness among the stakeholders, regarding the breast cancer. Statistics indicate that one in eight women will be diagnosed with breast cancer with their lifetime. As such, breast cancer is considered the most common type of cancer among women across the world. Early detection and improved treatment options have seen a rise in the number of breast cancer survivors especially in the United States. Susan G. Komen Foundation has been critical in helping improve breast cancer survival rates by sponsoring research, engaging in community health outreach, and through advocacy.
More than 100,000 volunteers are working for the organization within a network of one hundred and twenty-five United States and international affiliates. As per the Harris Poll Interactive, the Komen organization is treated as one of the most trusted not for profit organization in the United States. Over the past three years, the performance of the organization has deteriorated, primarily due to increase in operational costs, a decline in participation and revenues in their Race for the Cure events, and a corresponding increase in the CEO’s salary. There foundation is also facing a decline in donations. In 2013, Nancy Brinker, the CEO of the foundation received a 64% salary raise despite dwindling donations and cancellation of races. This salary increment raised her gross earnings to $684,000 per annual. Race cancellations were to begin in 2014. The foundation announced plans to cancel about half of its 3-Day races that were scheduled to take place in early 2014.
The foundation is named after the Susan Goodman Komen. She was diagnosed breast cancer at thirty-three years. She lived with cancer for three years and died at the age of thirty-six years from cancer. Susan’s younger sister gained awareness of the fact that people could survive more easily, if they become aware of the disease and it consequences. The mission statement of the organization is as follows:
The foundation is committed to saving lives by meeting the most critical needs in communities and investing in breakthrough research to prevent and cure breast cancer. The foundation has spent over $800 on research activities alone. From the financial statements, Susan G. Komen Foundation spends a large share of its resources on four key areas, which include research, health screening services, treatment services, and public health education. Public health education initiatives utilize the largest share of funds. Minor sources of expenses include fundraising costs as well as general and administrative expenses.
Employment structure of the organization
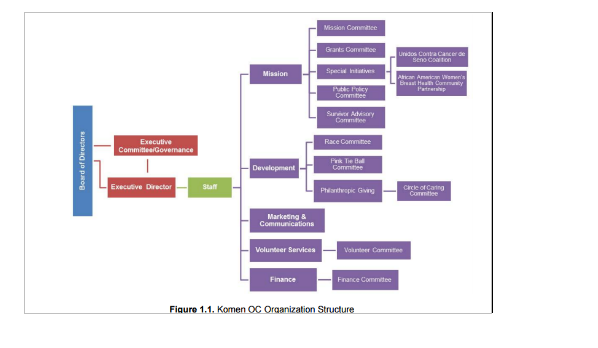
The management team is comprised of diverse individuals having diverse range of skills. The board is comprised of twelve members. They include Linda Custard, Nancy Brinker, Dan Glennon, Connie O’Neill, Linda Wilkins, Janet Dunn, Jane Abraham, Alan Fred, Kaye Ceille, Melissa Maxfield, Meghan Shannon, and Dr. Olufunmilayo Olopade. A further staff of twelve members takes part fund raising activity, getting grants and donations, marketing and information management. It is estimated that about 2,500 volunteers provide about 23,000 hours of service. Volunteers take part in various activities such as fundraising campaigns, management, and in a host of other organization’s programs. For instance, volunteers may organize Rally events in support of the foundation. Volunteers also organize various events such as tennis, golf, and other social events where they take opportunity to educate women about breast cancer. Participating in the events is encouraged. Volunteers can choose to hold their own ‘Passionately Pink’ event, which includes organizing various sport events such as golf. The funds received go to the foundation. Other ways of volunteering include becoming an advocate for the foundation and helping legislate change.
komen OC organization structure
Demographic information:
On the basis of the statistical and numeric information accumulated, there were four types of communities that were considered for further analysis:
1) African-American/Black women
2) Asian and Pacific Islander women, specifically Chinese, Filipino, Japanese, Korean, South Asian, and Vietnamese
3) Hispanic/Latina women
4) All women aged 65 years and older
Breast cancer is rare in women. In fact, the Susan G. Komen Foundation website indicates that about 1% of breast cancer incidences involve men. The reason for the low cases of breast cancer in men is due to underdevelopment of the breast tissue. When men reach puberty, high levels of testosterone hormone coupled by low estrogen hormone levels inhibits breast development. On the other hand, women experience complex breast development, which increases the risk of developing breast cancer. According to the Centers for Disease Control and Prevention, Whites experience higher breast cancer incident rates than any other ethnic group. African-Americans and then Hispanics follow in terms of incidence of breast cancer. Surprisingly, African-Americans have the highest mortality rates. This could be an indication of late diagnosis or lack of financial capacity to look for proper healthcare services.
Interviews and surveys:
In order to assess the insights, key interviews and surveys resulted into analyzing the information regarding the:
- A need for ongoing education – general breast health, screening, and treatment information; Help to clarify screening guidelines; specific individualized risk must be taken into consideration specifically for older adults
- An additional burden of cancer – financial costs, need for social support
- A need to make the available breast health resources available to all
- Importance for culturally and linguistically appropriate outreach, education and materials.
- Need for interpreter services
- Continued need for early detection services
- Opportunities for working with faith based organizations, community leaders, and senior centers
- Social media is not highly used but marketing/outreach opportunities exist.
Problems found via analyzing surveys and interviews regarding the reasons behind breast cancer:
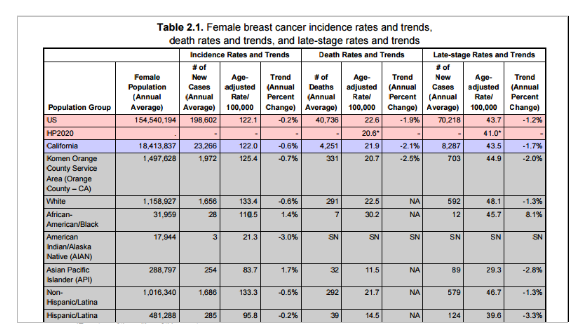
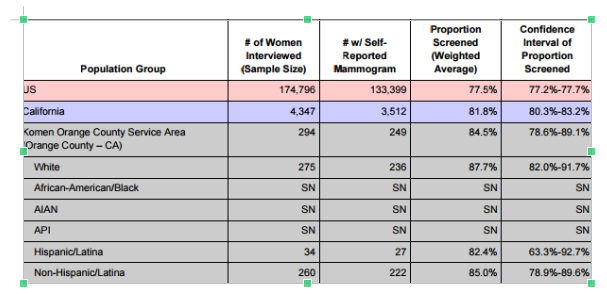
Based upon the findings it was analyzed that that over six percent of all women ages forty and older in Orange Community have not had a screening mammogram and an additional twelve percent have not had a mammogram within the last two years. The groups that did not seem to have screening mammogram were Hispanic that represented a twenty-eight percent, while Asians showed thirty-three percent. A history of late stage diagnoses was highlighted and major reasons for the cause of deaths. The incident rates by ages in the region indicate that Non-Hispanic White have the highest breast cancer rates across all age groups. Those above 65 years have the highest incidence rates, with about 487.3 per 100,000. African-Americans come second with an incidence rate of 383.1 per 100,000. The Hispanic/Latino comes third with an incidence rate of 315.9 per 100,000 for those over 65 years of age. Death rates from breast cancer are highest among African Americans over the age of 65. This group has a death rate of 153 deaths per 100,000 population. Non-Hispanic White comes second with a death rate of 110.3 per 100,000 population among those above 65 years. Death rate for African Americans is higher than the rate of all other ethnic groups across all age groups.
In order to encounter such problems there was need for the awareness among the stakeholders. People need ease of reach regarding the screening of breast cancer. This could enhance the early detection of the disease. Further reason for the problems identified were lack of education. In addition, awareness should include signs and changes in the breast and symptoms, available screening, treatment and diagnostic services, and age-specific screening guidelines/recommendations. Self-examination of breast cancer could also significantly help in the early detection of the disease. Women are generally encouraged to conduct monthly self-examinations, which involve examining whether there are lumps on the breasts. However, this method is considered confusing by some women due to lack of thorough awareness of their own body. More training is necessary to improve self-examination.
It was also analyzed that the African-American women were dying at an increasing rate relative to the White women. It was assessed that late diagnoses for the Black Women were the major reasons. Frequent mammograms are critical in recognizing the symptoms of the disease at an earlier stage, which improves the chances of cure. The Komen report indicates that African Americans are the majority group who has never had a mammogram. The specific number in this case is 13.5% of African Americans who have never had a mammogram test. This figure is high comparing with the population of Non-Hispanic Whites who have never had a mammogram, which is a partly 4%. These findings indicate that cancer screenings go a long way in enhancing early diagnosis and treatment.
Core motives behind operations of the operations of the organization:
• Promotion of inclusion efforts in the breast cancer community
• Guidance in grant priorities
• Informing public policy efforts
• Determining outreach and education needs
• Informing fundraising and marketing efforts
Female Incidents
Female breast cancer incidence rates and trends, death rates and trends, and late-stage rates and trends:
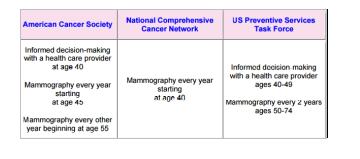
Breast cancer screening recommendations for women at average risk
Proportion of women ages 50-74 with screening mammography in the last two years, self-report
Gaps in breast health services included:
Access to care, including available surgeons that accept low cost reimbursement
Komen treatment funds; Awareness and a lack of education about breast health;
Financial support; Insurance coverage gaps
Challenges with the Affordable Care Act (ACA) and navigating the health system once
Enrolled and eligible for services; A need for language access and culturally sensitive services;
Transportation needs
A lack of ancillary and supportive services
Services outside of standard business hours (for example after hours, weekends
Walk-in flexibility); and Services for the uninsured
Issues encountered during the awareness program:
People are too busy with work (cannot take time off):
The health system is too difficult to navigate
People are busy taking care of family
Language barriers in accessing care
Fear that a mammogram is painful or uncomfortable
A lack of reliable transportation
Not sure where to go
Other health issues take a priority
Cost of getting treatment
Cultural barriers
Financial analysis:
Financial analysis is extremely important from the perspective of decision making, whether an organization is operating under service operations or manufacturing operations, profit making or non-profit making.
Viewing the balance sheet helps to assess the snap shot of the financial performance of the organization. Organization has total assets of $347,909,642 and $352,085,158 for the year 2016 and 2015. This shows a decrease of 1.2 percent in the economic resources the organization had over the period of time. A decrease in the economic resources seems to be a negative symptom. Fewer amounts of assets mean decrease in the efficiency. Over the period the balance of the net assets increased, which shows the enhancement in the balance that the organization lefts with after paying all the debt due. Key reason behind increase in the equity balance was the reduction.
Liquidity:
Current ratio of the organization seems to be greater than forty times. Over the period of one year this showed a declining trend, but this was minimal. Current ratio helps to assess that the ability of the organization in meeting its short term obligations via using the liquid assets.
Quick ratio is a conservative measure. This measure excludes inventory and prepayments. There is significant difference in the between the two ratios, and shows strong liquidity, but from the perspective of the trend, this is a negative symptom.
|
2016 |
2015 |
|
| Net assets | $ 198,442,585.00 | $ 177,240,730.00 |
| Total net public Revenues | 258,420,183.00 | 250,276,362.00 |
| Ratio |
77% |
71% |
The total net asset to revenue ratio has improved over the period. In 2015, the net asset to revenue ratio was 70.8%. This is calculated by dividing the net assets by total net public revenues. In 2016, there was a slight increase in net asset to revenue ratio to 76.8%. The organization seems to show an increase in the accumulation of receipts, mainly due to increased awareness among the public participants regarding breast cancer. Increased public revenue and support has the potential to change the ratio.
|
2016 |
2016 |
|
| Total net public Revenues | $258,420,183.00 | $250,276,362.00 |
| Total expenses | $237,218,328.00 | $268,859,656.00 |
| Ratio |
0.92 |
1.07 |
Despite of increase in the receipts in the form of donations and grants, the control over the expenses also has increased over the period of time. For the period of 2016, ratio seems to be less than one.
|
2016 |
2016 |
|
| Total net public Revenues | $258,420,183.00 | $50,276,362.00 |
| Total program service expense | $17,629,165.00 | $216,147,708.00 |
| Ratio |
7% |
86% |
Service expense to revenues have shown a positive trend, decrease in the ratio from the eighty-six percent to seven percent. The core reason behind this trend is the fact of reduction in the spending relating to the research, health education, screening services and treatment services. It is important for a non-profit to consider every factor of its operations.
Solvency:
Solvency focuses over the mix of debt and equity. More the debt involved in the operations of the organizations, higher the risk of the financial risk for the organization.
|
2016 |
2015 |
|
| Total debt | $ 149,467,057.00 | $ 174,844,428.00 |
| Total asset | $ 347,909,642.00 | $ 352,085,158.00 |
| Ratio |
42.96% |
49.66% |
Susan G. Komen Foundation seems to show improvement in terms of solvency. The higher the organization’s debt the more operational risks to take into consideration. Debt is a significant proportion in the debt-equity mix and may lead to higher financial risk and more fixed cost burden on the organization. The organization can reduce debt by increasing funding or looking for more donors. The organization can engage in more funding campaigns in order to raise money for charity events. Another way of reducing debt is by cutting of funding of some programs. This could enable the organization stay within a particular manageable budget.
Trends in the financial statements:
| Consolidated statement of financial position | |||||||
|
2016 |
2015 |
Increase or decrease over the year | |||||
| Assets | |||||||
| Cash | $ 129,199,058.00 | $ 154,493,674.00 |
-16.37% |
||||
| Investments | $ 172,987,203.00 | $ 150,955,835.00 |
14.59% |
||||
| Receivables | $ 40,873,951.00 | $ 39,969,851.00 |
2.26% |
||||
| Prepaid expenses | $ 2,508,658.00 | $ 3,867,213.00 |
-35.13% |
||||
| PPE | $ 2,340,772.00 | $ 2,798,585.00 |
-16.36% |
||||
| Total assets | $ 347,909,642.00 | $ 352,085,158.00 |
-1.19% |
||||
| Liabilities | |||||||
| A/P | $ 7,928,000.00 | $ 7,806,906.00 |
1.55% |
||||
| Deferred revenue | $ 2,373,457.00 | $ 2,560,573.00 |
-7.31% |
||||
| Grants | $ 139,164,800.00 | $ 164,476,949.00 |
-15.39% |
||||
| Total liabilities | $ 149,467,057.00 | $ 174,844,428.00 |
-14.51% |
||||
| Net Assets | |||||||
| Unrestricted-un-designed | $ 118,171,612.00 | $ 119,868,140.00 |
-1.42% |
||||
| Unrestricted-board designated | $ 1,000,000.00 | $ 1,000,000.00 |
0.00% |
||||
| Total unrestricted | $ 119,171,612.00 | $ 120,868,140.00 |
-1.40% |
||||
| Temporary restricted | $ 78,945,973.00 | $ 56,047,590.00 |
40.86% |
||||
| Total net assets | $ 325,000.00 | $ 325,000.00 |
0.00% |
||||
| Total net assets and liabilities | $ 347,909,642.00 | $ 352,085,158.00 |
-1.19% |
||||
| Consolidated statement of activities |
Increase/decrease |
|||||
| Public support revenues |
2016 |
2015 |
|
|||
| Restricted investment funds | $ 210,864,780.00 | $ 201,051,231.00 |
4.88% |
|||
| Contributed goods | $ 69,261,921.00 | $ 66,318,719.00 |
4.44% |
|||
| Less direct benefits to donors | $ (22,230,751.00) | $ (25,130,890.00) |
-11.54% |
|||
| $ 257,895,950.00 | $ 242,239,060.00 |
6.46% |
||||
|
|
||||||
| Interest and dividends | $ 2,622,028.00 | $ 3,624,040.00 |
-27.65% |
|||
| Net realized gain on investments | $ 3,731,691.00 | $ 20,478,716.00 |
-81.78% |
|||
| Net unrealized losses | $ (6,415,959.00) | $ (16,581,441.00) |
-61.31% |
|||
| Other | $ 586,473.00 | $ 515,987.00 |
13.66% |
|||
| Net asset released from restrictions |
|
|||||
| Total net public support and revenue | $ 258,420,183.00 | $ 250,276,362.00 |
3.25% |
|||
|
|
||||||
| Expenses |
|
|||||
| Program services |
|
|||||
| Research | $ 33,529,701.00 | $ 41,498,217.00 |
-19.20% |
|||
| Public health | $ 105,307,923.00 | $ 124,557,577.00 |
-15.45% |
|||
| Health screening | $ 27,804,544.00 | $ 32,971,282.00 |
-15.67% |
|||
| Treatment services | $ 12,986,997.00 | $ 17,120,632.00 |
-24.14% |
|||
| Total program services | $ 179,629,165.00 | $ 216,147,708.00 |
-16.90% |
|||
|
|
||||||
| Supporting services | $ 33,694,581.00 | $ 31,992,548.00 |
5.32% |
|||
| Fund raising costs | $ 23,894,582.00 | $ 20,719,400.00 |
15.32% |
|||
| General admin | $ 57,589,163.00 | $ 52,711,948.00 |
9.25% |
|||
| Total supporting services | $ 237,218,328.00 | $ 268,859,656.00 |
-11.77% |
|||
|
|
||||||
| Total expenses | $ 237,218,328.00 | $ 268,859,656.00 |
-11.77% |
|||
|
|
||||||
| Change in net assets | $ 21,201,855.00 | $ (18,583,294.00) |
-214.09% |
|||
| Net assets at the beginning of the year | $ 177,240,730.00 | $ 195,824,024.00 |
-9.49% |
|||
| Net assets at the end of the year | $ 198,442,585.00 | $ 177,240,730.00 |
11.96% |
|||
Auditor’s findings:
After reviewing the audit report of the organization, it becomes visible that the core responsibilities of the auditor are related to expressing an opinion on the financial statements of the organization. The audit engagement was performed by the Ernst & Young. The audit of the financial statements was conducted as per the rules and guidelines of the US regulations. The audit engagement also considered the reasonableness of the policies and procedures of the organization. The audit opinion was not concerned with the appropriateness of the internal control nor was it aimed to express an audit opinion. Audit opinion on the financial statements was unqualified, there were no material misstatements found in the financial statements in all aspects of the consolidated financial statements.
Various donors, partners, affiliates, and corporate partners are key to Susan G. Komen Foundation’s smooth running in terms of finances. The foundation has a number of key partners, corporate partners as well as donors who are crucial to its ability to meet target objectives. Corporate partners include American Airlines, Bank of America, Ford, Simon, KitchenAid, New Balance, Major League Baseball, manduka, and Wacoal. Corporate partners are key in event sponsorships, volunteerism, philanthropic giving, employee engagement, community engagement, and cause marketing. The foundation’s partners include American Airlines, Dallas Cowboys, Bowl for the Cure, Bank of America, Ford, and Caterpillar Foundation. The partners have been key in proving the greatest financial support to the foundation. The partners have also been key in conducting awareness activities. Donors may involve individuals or corporate organizations.
Future outlook:
The purpose Susan Komen is serving is extremely philanthropic and highly sensitive for the stakeholders. For this type of firm each and every stakeholder is important, as life is precious to every individual. As people are becoming more and more educated the importance of the organization is simultaneously increasing. People definitely will give charities and grants if there is further education given, mediums like Facebook, twitter and other social media sites can be used to boost the revenues and serve the purpose. The long run future of the organization seems to be extremely positive. The organization has planned a number of future events to raise funds for various activities. Some of the upcoming events include Komen Race for the Cure, Susan G. Komen 3-Day, 2017 Komen South Florida Race for the Cure, Komen Greater Fort Worth Race for the Cure, and among others.
Conclusion
Susan G. Komen Foundation is critical in proving breast cancer education, supporting breast cancer screening, providing funds for treatment, and in sponsoring research on breast cancer. This nonprofit organization has been a key pillar in the society in reducing mortality rates among women attributed to breast cancer. Through events and collaborating with corporations and donors, the foundation is able to raise money for charity events and to cover day-to-day expenses. In the recent past, the organization has come under heavy scrutiny owing to the manner in which it spends funds. In 2013, the CEO salary was raised by 64% amid concerns that the foundation was in deep financial challenges. Nonetheless, the organization continues to be a key pillar in the fight against breast cancer in the United States.
Reference
http://ww5.komen.org/AboutUs/FinancialInformation.html
http://komenoc.org/about-us/staff-directory/
http://komenoc.org/wp-content/uploads/2013/10/Komen-Orange-County-2015-Community-Profile-Report.pdf
http://aaajournals.org/doi/full/10.2308/ogna-50647?code=aaan-site
http://komenoc.org/wp-content/uploads/2013/10/Komen-Orange-County-2015-Community-Profile-Report.pdf
www.brightscope.com/form-5500/basic-info/139674/The-Susan-G-Komen-Breast-Cancer-Foundation-Orange-County-Affiliate/141789/Susan-G-Komen-Foundation-Orange-County-Affiliate-Employee-Savings-Plan/2
http://www.nationalbreastcancer.org/
https://www.cdc.gov/cancer/breast/statistics/race.htm