Introduction
NVIDIA Corporation is an American based technology company. It basically designs graphics processing units, gaming among other developed mobile computing systems. Established in the 1990s with a startup capital of $40,000 the company has recent financial reported growth across all segments. On this report, both theoretical and practical cost of capital estimation and company valuation are discussed. Exhibits, Appendix for this report and their sources are also presented for ease understanding.
Overview:
- Introduction to theory of cost of capital
- Models used to estimate cost of capital
- Data used in models for cost of capital estimation and its application to valuation.
The term Cost of capital can be explained from two perspectives. To the Investors, it is the rate of return required by the market to attract funds for investment. Primarily on the company capital structure, it includes the following three components; Long-term debt, preferred equity and common equity. Key characteristics of cost of capital are;
- It is associated to the market.
- Investment driven
- Metrics are based on nominal terms
- Based on market value and not book value
Case1. Sales growth forecast and terminal growth rate after terminal year.
Sale forecasting means projection of sales performance at a terminal period. This is affected by both external and internal factors within the industry and the company. Methods of performing a sale forecasting Qualitative and Quantitative. Quantitative forecasting applies historical data and make assumption on pattern to forecast the future. Sales forecast is useful to the investors in making decision regarding investment. We first gather data of sale values for previous years. For this case, we shall use a Time series model moving average method. This take average of the sales over set number of years. The formula below is applied;
Sales growth Forecast;
Forecasting sales involves the following steps for an Enterprise;
- Getting the Historical data and the current year sales
- The Income Statement starts with Current year sales always
- Forecasting the sales growth with be given by
Sales= Previous year’s sales * (1+ growth)
The terminal growth rate is a steady rate at which a company expected free cash flow are assumed to grow at. The terminal growth rate formula is given as follows,
Where, .
Weighted average cost of capital is the blended cost of capital across all sources such as preferred shares, common shares, and debts. It is calculated as follows
Valuation
- Start with enterprise cash flows derived earlier.
- Compute the growth rate in enterprise cash flows.
- Input: Enterprise cost of capital (aka wacc) is assumed constant for all years.
- Make sure that the enterprise cash flows reach terminal growth before computing terminal value. Terminal value is computed at the end of Year 5 because the enterprise cash flows reach terminal growth only after that year. The formula is C5*(1+g)/(wacc-g) or C6/(wacc – g).
- Enterprise value = PV of enterprise cash flows until Year 5 + PV of terminal value
- Historical data: Initial ending net financial liabilities.
- Subtract net financial liabilities.
- Equity value = Enterprise value – Net financial liabilities
Inferring cost of equity
If one used firm’s cost of equity to derive wacc, then this step is indeed redundant. However, in many instances, we assume that the firm’s wacc is the same as its competitors, or we use a subjective estimate of wacc. In these cases, it is useful to know the cost of equity implied by wacc and leverage.
See the equation for cost of equity (re) specified earlier. re generally varies across time if leverage based on market values changes. Even if NFL/book value of equity is kept constant, as is the case in this model, the ratio of NFL to market value of equity changes over time. Thus, re varies across time. Therefore, you cannot discount distributions to shareholders at the current re to derive the current equity value.
Bond Information of NVidia Corporation
NVidia Corporation issued an International bond valued at USD 1,000M. the bond is expected to mature in the year 2021 with a coupon rate of 2.2%. The bond was sold at a price of 99.802%. The Bookrunner were Goldman sachs, Morgan Stanley and Wells Fargo. A bond issue is meant to help raise finance by the issuer. For a bond, it is redeemable after a period of time. To estimate the yield the firm may have to provide the investors while making a new issue.
To get the current market value of NVidia corporation Bond issue (US67066GAD60).
The market value of a bond is like the present value of all future cash flows. Therefore the face value is needed, the coupon rate, maturity period and market interest rate.
A bond is therefore a form of debt that an investor expects periodical interest payments that are based on a stated coupon rate and return the original principal at maturity. Face value is $1,000M, Maturity 5 years, Coupon rate 2.2% , assumed 9%.
The following formula applied
PV( bond) = =
To find the yield on a company’s recently issued long term bonds, given it has bonds outstanding or it can be can be found by rating the bond also. This can also be done by assessing the yield on other bonds with a similar rating and in the same industry.
The yield rd is the coupon rate that the company will have to set on a new bond.
Other Metrics involved in cost of capital;
Cost of preffered stock. This is the rate of investment return by holders of a company’s preferred stock. Calculation involves diving the annual dividend payment on the preferred stock by the preferred stock’s current market price.
Par value $100, Dividend yield = 10%, issue price = $116.95, Flotation cost = 5%
=9.0%
Methods of determining the Cost of equity
The existing common stock also called retained earning can be calculated using below methods.
This can be done using three known methods;
- Capital Asset pricing method. This model describes the relationship between the expected return and the risk of a security. The CAPM shows that the return on a security is equal to risk-free return together with a risk premium.
CAPM formula and calculation,
Where Ra is the expected return on a security, Rrf is the free rate, Ba is the Beta of the security and Rm is the expected return on the market.
Risk premium is given by subtracting
- Discounted cash flow method. When investors expect returns in form of dividends that can be done quarterly or half yearly. The discounted cash flow model for measuring the cost of retained earnings is given by
G is the growth rate of the stock
- Own-bond- yield plus Judgmental risk premium
This is given by
For this case using data available for the company NVidia corporation it is easy to determine the Cost of equity using both methods.
Cash Flows Statement NVidia Corporation
Cash flow statement equation is given by;
Operating Income is got by subtracting Operating revenues from Operating expenses
NFE is obtained by subtracting financing income from financing expense
- Method 1.
For this to be possible, reformulated income statements and balance sheets for a firm must be done. With reformulated statements, any of Method 1 or Method 2 of calculating free cash flow can be done.
| NVidia corporation: Calculation of Free Cash Flow for 2016 (in Millions) | |||
|
Method 1: |
|||
Operating income 2016
Net operating assets 2016Net operating assets 2015
Free cash flow 2016 |
$61,439 $63,382 |
$ 16,072
-$1943 $18,015 |
|
Note:
We have the Cash flow statement for year 2010 given. To calculate the Free cash flow for year 2016 we take Cash from operating activities subtract the capital expenditure.
Total Operating activities $16,072M
-Capital Expenditure $ 3,067M
-Dividend to shareholders $5,458M
Free Cash Flow $7,547M
The numbers differ. Method 1 above value is different from the value obtained under ordinary method.
- Method 2. Calculate for free cash flow.
For this the calculation will involve the sum of NFE for year 2016, the change in NFA and the dividend.
We take the NFA for year 2015 and 2014. The dividend is on the Statement of income.
NVidia Corporation: Calculation of Free Cash Flow for 2016 (in Millions)
| Method 2: | C – I = NFE – DNFO + d | ||
| Net financial expenses 2016
Net financial obligations 2016 Net financial obligations 2014
Net dividend 2016
Free cash flow 2016 |
$ $ |
$
()
$()
|
|
The two methods should give the same result provided income is a comprehensive income. Free cash flow appears to be different under the two methods. The difference is occasioned by the fact that we cannot reconstruct a deferred compensation asset, an operating asset. The Free cash flow calculation is dependent on income and asset aspects which is not the issue for operations.
Method 2 offers the accurate calculation.
- Calculate the net payout to shareholders from the cash flow statement. (Make remarks)
To achieve this. We get the free cash flow value. The Free Cash Flow value is then multiplied by the dividend payout ratio.
- What is the relevance of the supplemental disclosure at the bottom of the cash flow statement?
This exists so that adjustments made to the cash flow statement are known. There are three categories of this. Cash paid for interest and income taxes. The Reconciliation Schedule and Non-cash investing and Financing activities.
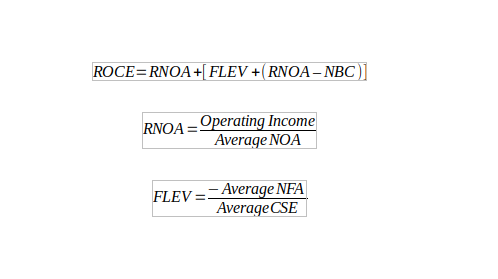
The return on common equity
Weighted Average Cost of Capital (WACC)
This is a rate at which a company is expected to make pay out on all its average securities holders to finance its assets. It is in the company cost of capital. This rate is influenced by the external market and not within.
The formula for this rate is is;
Can also be given by
Where Re is the cost of equity Rd is the cost of debt, E is the market value of the firm’s equity, d is the market value of firms debt, E/v is the percentage of financing that is equity, D/V is the percentage of Financing that is in form of a debt and Tc is the corporate tax rate.
Works Cited
Shannon P. Pratt. Cost of Capital: Estimation and Application. 2014.
Stephen h. Penman. Financial Statements Analysis and Valuation. 2013.