Assignment
Elasticity and Labor Market Equilibrium
In this Assignment, you will elaborate price elasticity of demand and supply in the short run and long run. You will evaluate factors that change equilibrium wage rate and employment level. Moreover, you will calculate total revenue product and marginal revenue product, and compare them with total cost and marginal cost in order to figure out optimal quantity of labor that should be hired to maximize profit.
Sample paper
Elasticity and Labor Market Equilibrium
1. Is the price elasticity of demand for gasoline more elastic over a shorter or a longer period of time? Explain.
Due to the nature and use of gasoline, its prices are expected to be more elastic in the long-run rather in the short-run. Increasing the prices of the gasoline in the short-run is expected to reduce the demand of the same compared to an increase of its price in the long-run considering that people cannot do without it.
2. Is the price elasticity of supply, in general, more elastic over a shorter or a longer period of time? Explain.
The supply curve is usually less elastic in the short-term as compared to the long-term considering that it may take time for people to adjust to the new demand. However, price elasticity is widely influenced by the prices of the commodities in the market (Png, 2013).
3. Why is the supply curve for labor usually upward sloping? Explain.
The supply curve curves upward as a firm increases its labor quantity which in turn increases it the marginal cost of labor. At the highest point of the curve where the highest wages are realized, the curve is bound to bend backward. This curve is usually influenced by those individuals in the high pay bracket willing to take a pay cut for them to enjoy more leisure time. However, the amount of labor supplied by each in each wage bracket highly influences the nature of the curve.
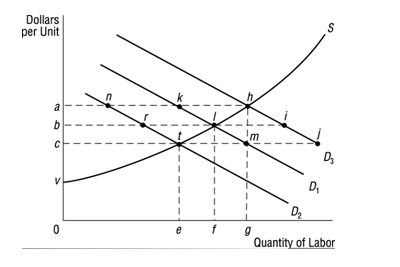
4. In the graph below, assume that the market demand curve for labor is initially D1. The market supply curve for labor is indicated with figure “S”. Wage rate is depicted on the other things held constant vertical axis (dollars per unit) ad employment level (quantity of labor) is depicted along the horizontal axis. Answer the following questions.
-
What are the initial equilibrium wage rate and employment level?
The initial equilibrium wage rate and the equilibrium employment level will be I and b.
-
Other things held constant, assume that the price of a substitute resource decreases.
What will happen to demand for labor? Will it increase or decrease?
A decrease in the price of the substitute resource will lead to an increase in demand of the same. Thus the demand for the labor will increase considering that there will be a need to increase the productivity of the product (Gal-Or, 2013).
What are the new equilibrium wage rate and employment level?
The new level of wage rate as a result of the increase in demand of labor and employment level will be t and c.
-
Other things held constant, suppose that demand for the final product increases. Using labor demand curve D1 as your starting point, what happens to the demand for labor?
What are the new equilibrium wage rate and employment level?
The new equilibrium of the wage rate and employment level will be h and d.
-
Assume this industry is dominated by non-union workers. How would the equilibrium wage compare to that earned in a similar industry with similarly skilled union workers? Explain.
Considering that union workers are likely to be paid higher than non-union workers, there is a possibility that the equilibrium wage will remain the same (Gal-Or, 2013).
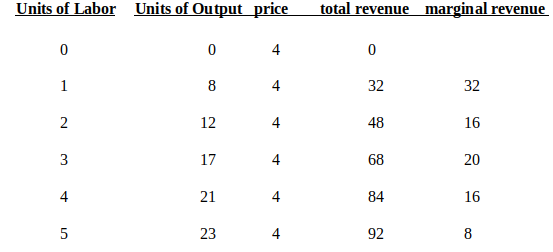
5. Use the following data to answer the questions below. Assume a perfectly competitive product market.
-
Calculate the total revenue product and marginal revenue product at each level of labor input if output sells for $4 per unit.
-
If the wage rate is $15 per hour, how many units of labor will be hired?
The highest amount of marginal revenue just before the drop gives the ideal number of labor to hire and in our case it will be 20. Thus the amount of labor to be hired will be:
20*15= $ 300
Related paper: Costs and Cost Minimizing Output