Question
Economic Order Quantity
Analyze the following scenario:
Meals for the Homeless buys 30,000 large cans of green beans each year.
The cost of each can of beans is $4.
The cost to place an order for beans, including the time of the employee placing the order, shipping, and so forth, comes to $20 per order.
The out-of-pocket carrying costs (for storage, etc.) are $0.30 per can per year.
In addition, Meals calculates its interest at 5 percent.
How many cans should be ordered at a time?
How many orders should there be each year?
What are the total ordering costs and carrying costs at the EOQ?
Contrast the total of the ordering costs and carrying costs at EOQ to the total ordering and carrying costs if the cans were all ordered at the beginning of the year. (You will need to read and understand Appendix 7-A to complete this discussion).
Clearly label the calculations of the economic order quantity using an Excel worksheet. Use formulas to calculate the EOQ and format the cells to insert a comma if there is more than three numbers. Round to the nearest whole number.
Explain the advantages and disadvantages of EOQ in a Word document not to exceed 200 words.
Sample paper
Economic Order Quantity
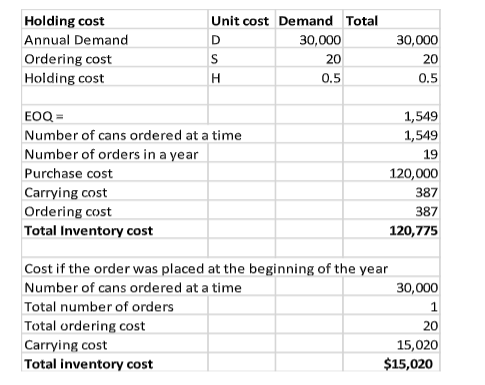
If the cans were all ordered at the beginning of the year, the total inventory cost would be higher. Total inventory cost for cans ordered periodically adds up to $12, 0774.6 while the total cost of total inventory ordered at the beginning of the year is $15,020.
There are certain benefits as well as drawbacks in using the Economic Order Quantity concept to determine optimal stock levels. One of the benefits of EOQ is that it reduces inventory levels and consequently stock holding costs. EOQ analysis provides business owners with information about the most economical quantity of stock they should purchase. Another benefit of the model is that it is specific to the business and hence of great use to the business. EOQ encourages businesses to purchase stock in large quantities which enables them to obtain large quantity discounts. Lastly, it encourages more efficient production planning since orders follow a similar sequence (Finkler et al., 2013).
On the flip side, EOQ analysis is based on assumptions. For instance, there is the assumption that demand for products is constant throughout the period while in reality, demand for various products keeps fluctuating. The model also assumes fixed stock holding charges, ordering charges, and costs of inventory units. Another drawback is that EOQ is inflexible to consumption patterns. If a review is conducted and then the usage rate changes, the business may run out of stock before the next period. Lastly, reorder quantities may not be entirely correct (Finkler et al., 2013).
Reference
Finkler, S. A., Purtell, R. M., Calabrese, T. D., & Smith, D. L. (2013). Financial management for public, health, and not-for-profit organizations (4th ed.). Upper Saddle River, NJ: Pearson Prentice Hall.
Read also: Investment Decision Analysis scenario for Duncombe Village Golf Course